Terrane Prism
7-app suite I led for 5 years. Unified 5 departments, saved about $500K a year, and cut cycle times 13%.
5 departments, each with workarounds
A self-taught coder held the whole system together with band-aids, toothpicks, and glue. Impressive, but hitting a ceiling.
70% standard, 30% can’t be shortcut
Building separate solutions per department would’ve meant five systems that didn’t talk to each other.
One architecture with room for both
Nesting hierarchies and parent-child relationships that let broad processes get specific when they needed to.
7 apps over 5 years, $500K saved annually
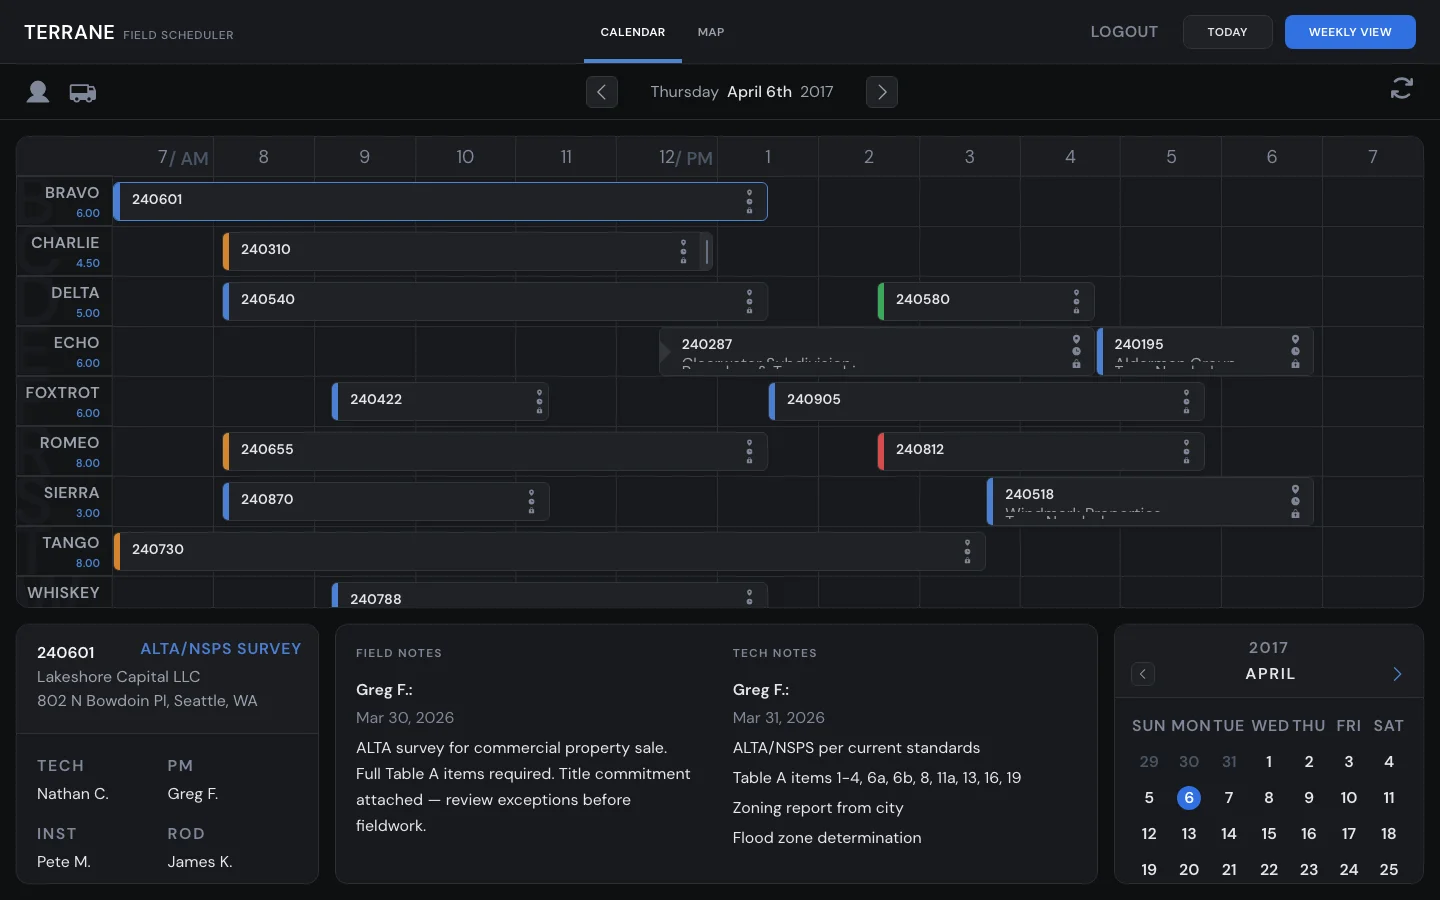
Desktop scheduler, mobile field portal, per-role dashboards, revamped databases and analytics.
When I walked into Terrane Land Surveying in 2017, they had an internal system that we'll call "The Bridge." Surprisingly functional, honestly. Visually...challenging. It was built by a technical person who taught themselves to code and held the whole thing together with band-aids, toothpicks, and glue. Again, impressive. But it was built in silos, one piece at a time, while the business kept running around it. Five departments, each with their own workarounds and frustrations and bottlenecks.
Before-state diagram or screenshot of 'The Bridge' (blurred/anonymized)
About 70% followed a standard workflow. The other 30% couldn't be changed.
Scheduling coordinators were losing about 30% of their time navigating the interface and looking stuff up. Field crews had rudimentary mobile access, so they'd miss key information on field visits and have to go back out (costing Terrane an average of $1,000 per return visit). Operations managers couldn't see accurate project status across the business.
"It's powerful to have a tool like this, but it feels like we've hit a ceiling with how it's put together. Too many workarounds, too many fields, too many places to navigate."
"I'm excited to see how you can unlock the potential of all of our internal knowledge and skills. We have guys here that learned from their Dad and their Dad's Dad."
Stakeholder interviews, Week 1One unified architecture that gets specific when it needs to
We decided to rebuild from the ground up. One unified architecture with nesting hierarchies and parent-child relationships that let broad processes get specific when they needed to, with guardrails to stop the custom workarounds people had been inventing on their own. Over almost five years, I designed and led a custom suite of software that had 7 individual apps ranging from fully custom tooling to customized out-of-box solutions (Zoho/Quickbooks).
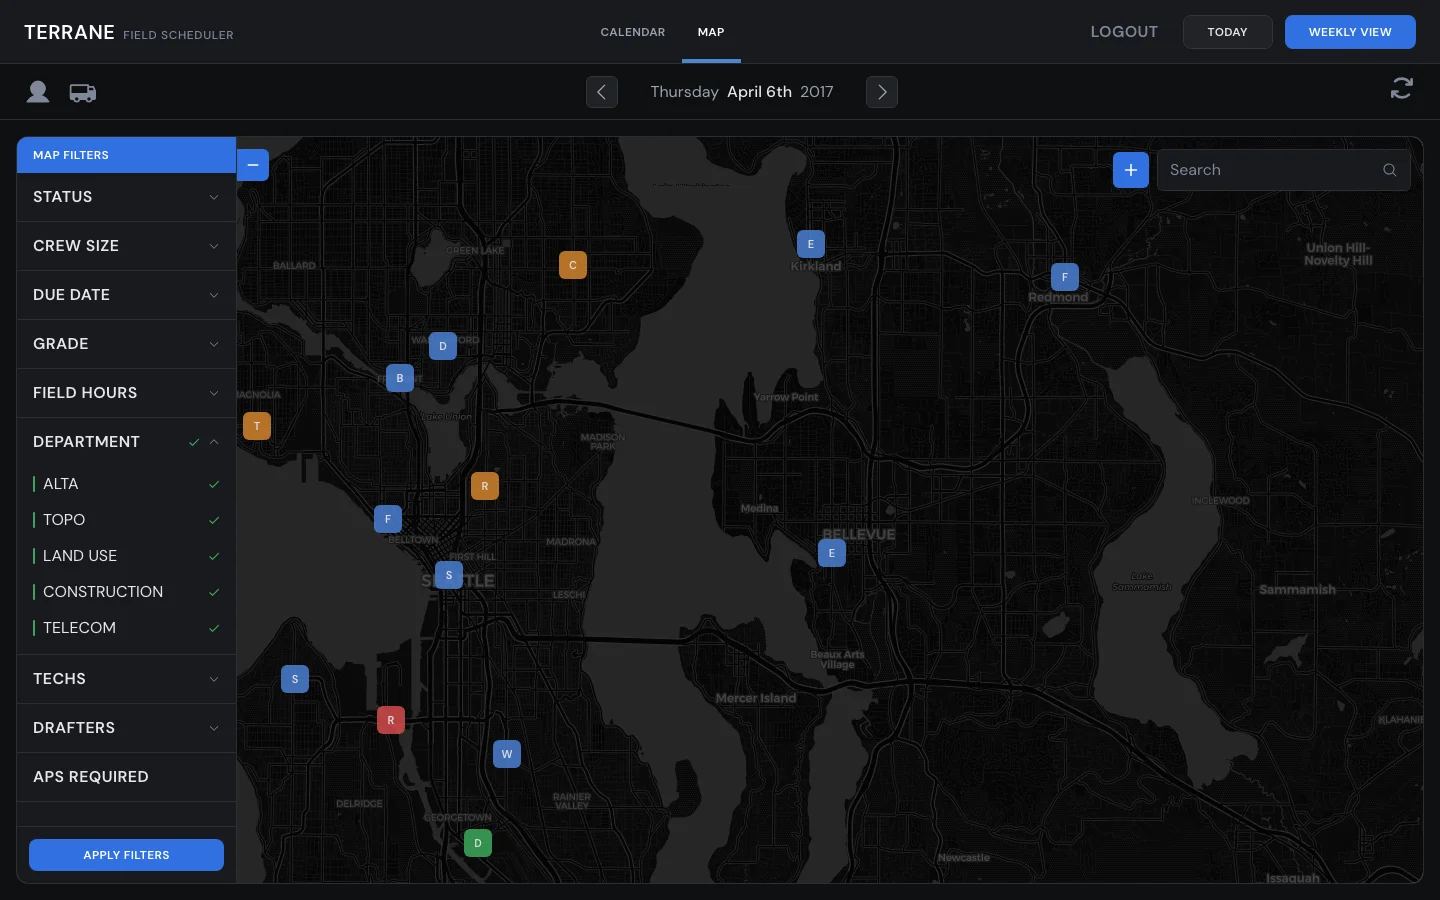
A desktop scheduler with drag-and-drop and integrated ArcGIS mapping. A mobile field portal with GPS, offline capability, and a special instructions checklist that field crews had to confirm before leaving a site. Customizable, per-role dashboards with personalized metrics and project queues. Revamped databases and analytics processes that gave operations real visibility for the first time.
Architecture diagram — how the 7 apps connect, the parent-child data model, and the 70/30 standard-vs-custom workflow split
The cross-department work doesn't show up in the metrics, but it's what made the software stick
My design influence ended up going well beyond the software. I started running periodic process audit sessions with the five department heads and the COO, surfacing what new services or products each department had started offering, and figuring out how to keep those needs in alignment with the unified workflow we were building. Similar structure, same language, same data points across departments, with enough flexibility for each team to run efficiently. Without that, people would invent workarounds, dirty data would pile up in The Bridge, and the analytics tools would have blind spots.
The work saved about $500K annually when the whole system got up and running. Cycle times dropped 13%. Field crew go-backs dropped 10%. The biggest lesson I took with me: planning and prioritization are most of the work. With contracted devs at high hourly rates, every poorly scoped sprint burns money fast. That's just as true now that I build with AI. The code execution keeps getting faster, but choosing what to build and when is still (or should be) 70 to 80% of the effort.
Impact metrics visualization \u2014 before/after numbers for cost savings, cycle times, and go-backs
Optional